MQTT Matrixboard
| authors: | Sam Laan |
|---|---|
| date: | March 2020 |
Description
This page contains the information needed to run the MQTT C++ matrixboard solution. It is assumed that the MQTT broker and paho C++ library are already installed. If not please refer to the MQTT C++ page (MQTT C++).
How to run
Note
For collecting measurements The collection of measurement data is built within the application. It is stored in a .csv file. To create this file please refer to Measurement file
To run the program navigate to the /src/demonstrators/ComparedToOtherProtocols/MQTT/MatrixBoard/C++ folder of the repository. The source code and CMakeLists of the program are in this folder. To build the solution perform the following commands:
mkdir build
cd build
cmake ..
make -j4
An executable called ‘mqttmatrixboard’ should have appeared in the build folder. To make the program work a broker must be running. This broker can be started by using the following command in terminal:
mosquitto
When the broker is started, it’s time to start the program. This can be started by running the following command:
./mqttmatrixboard
The matrixboard application will ask for a number. This number is the id of the matrixboard. The matrixboard will publish to a topic that has the matrixboard id as its name. Other matrixboards can subscribe to this topic to receive the information. Matrixboards will subscribe according to the matrixboard problem description (Matrix Board Communication). Besides that, this number will also be used as client id within MQTT. If you try to start another client(matrixboard) with the same ID it will kill the old matrixboard and then start the new one.
Performance
The collection of performance measurements is built into the application itself. It writes the time it sends and receives messages to a CSV file. This CSV file can be used to visualise the data using various tools to do so. In this case, Excel has been used. The choice for Excel was made because it is a commonly known and used program and it is installed on a Capgemini/Sogeti laptop by default. The processed_measuremens.xlsx file shows an example of how to visualise the CSV data using Excel and Power Pivot. More on Excel and Power Pivot can be found here Power Pivot.
Findings
The performance test was executed with 3 matrixboards and resulted in the following graphs (time is measured in ms).
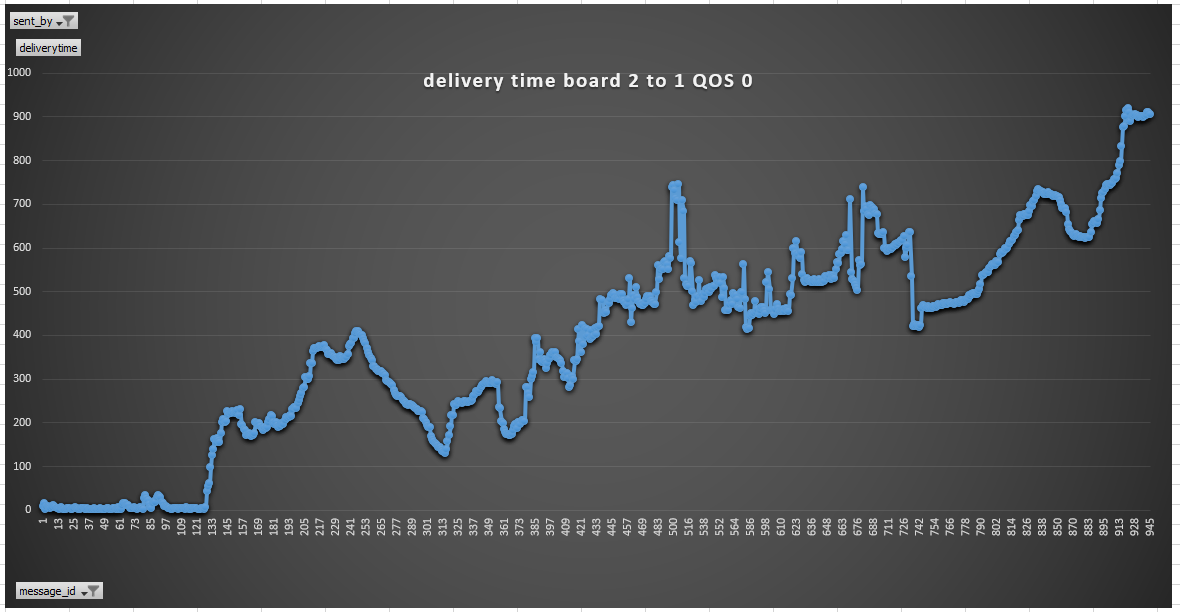
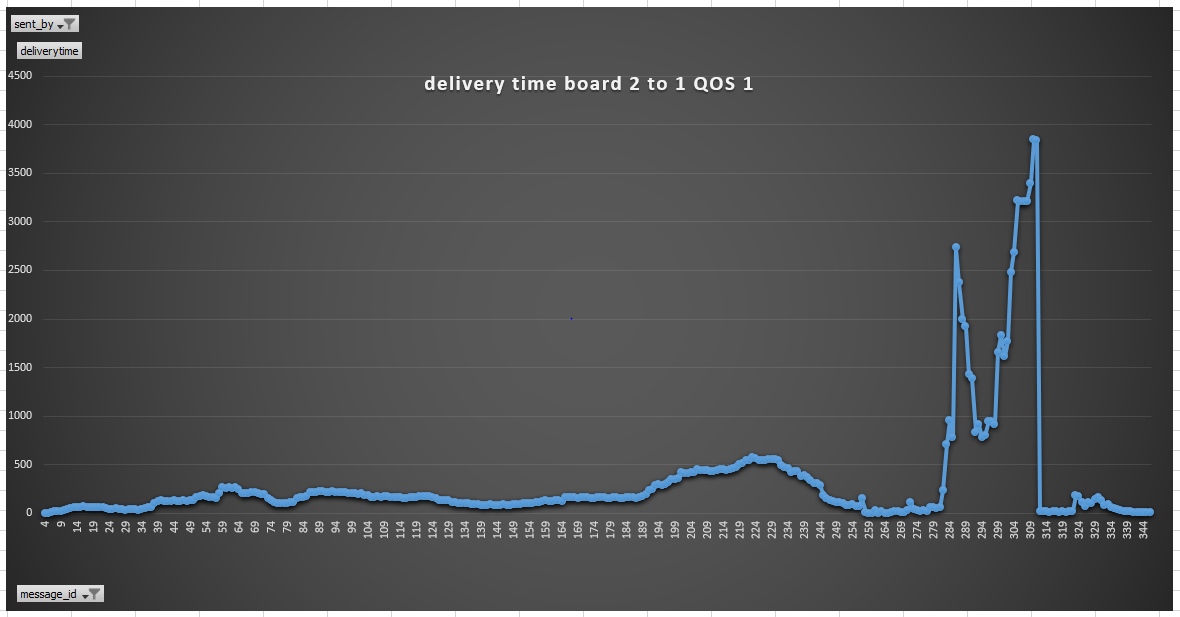
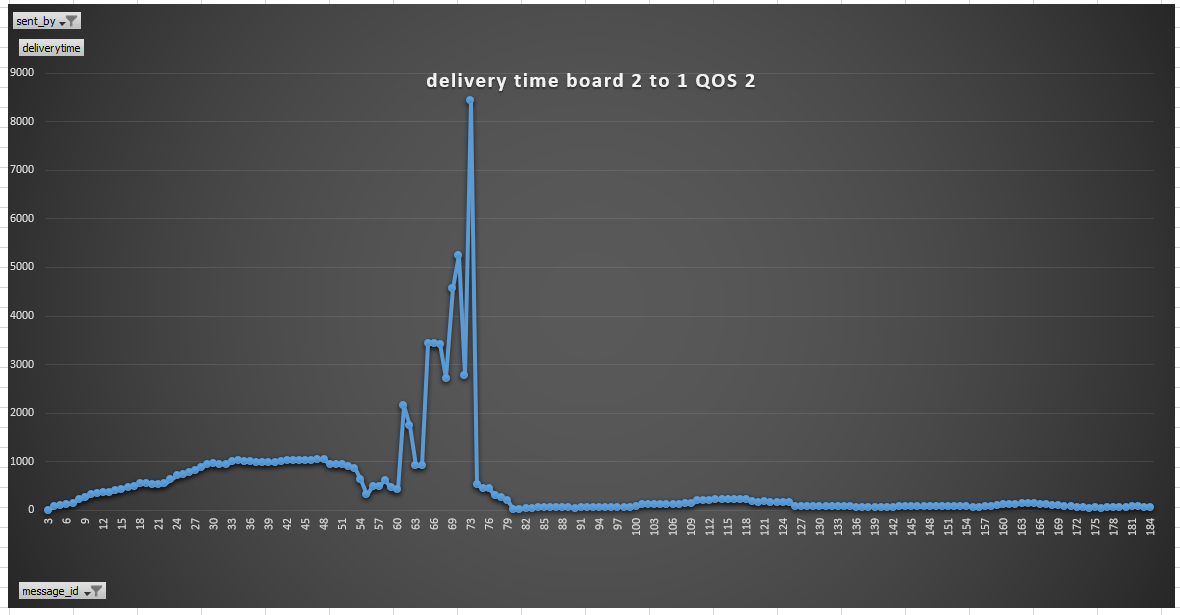
These graphs show that the QoS 0 can send the most messages in a short amount of time. The downside is that the application crashed after about 950 messages because of an overflowing buffer MQTT error [-12]. This is because MQTT was not designed to handle this much messages in such a short amount of time(see the resilient mqtt application link). With QoS 1 the delivery time is more stable, this is because QoS 1 is slower which causes the buffer to not overflow during the test. An increase in delivery time can be seen once board 3 is up(around 184). Besides this, the spike is when board 3 goes the down. After that messaging resumes with low delivery time. Almost the same can be said for QoS 2 although QoS 2 is a bit slower compared to QoS 1. Taking almost a second for receiving a message whilst 2 boards are up. This data was collected using the first version of the MQTT matrixboard solution. Delivery time is the time between the sending of a message from one board To the time of receiving the message by another board.
Measurement file
The file in which the measurements are stored in CSV format is called measurements.csv. An executable is built during the ‘make’ process to create this CSV file in correspondence with the data that will be stored in it. This executable deletes any existing file called measurements.csv in the build folder and creates a new one containing the data headers only. To start the executable run the following command:
./measurementsfiles
Links
- resilient mqtt application: https://www.hivemq.com/blog/are-your-mqtt-applications-resilient-enough/#throttling