RoundTrip
Findings Round-trip C++
The Round-trip applications for ZMQ and MQTT write their results to a CSV file called roundtrip.csv. This CSV file can be used to process the results of experiments done using the application. There were already two experiments done concerning inter-process communication(IPC) and inter-device communication(IDC). The results of these experiments are described below.
IPC experiment
The IPC experiment was conducted on the Lenovo Thinkpad T470 20HD000MUK. Three nodes were used to conduct the experiment. The following graph shows the results of the experiment for each protocol for a different number of messages. This was done to put them in direct comparison. No quality of service policies were used, for MQTT this means that level 0 was used.
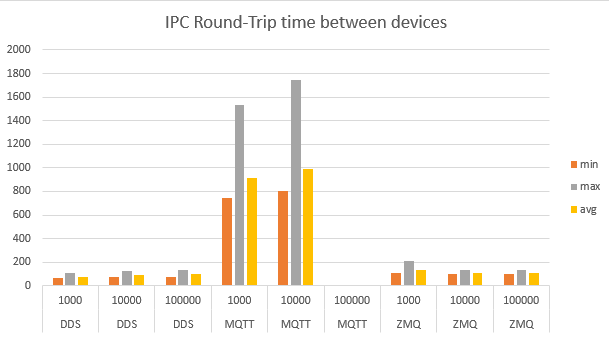
The value on the X-axis is time in microseconds. The values on the Y-axis is the protocol and the number of messages. MQTT gets outperformed by each other, by a factor of about 5 with DDS and a factor of 3 compared to ZMQ. Besides this MQTT also suffered from package loss when sending 100000 messages leaving the roundtrip unable to finish.
IDC experiment
The following setup was used for the IDC experiment:
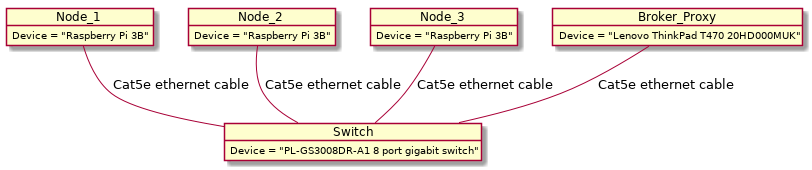
Three nodes were used to conduct the experiment. The following graph shows the results of the experiment for each protocol for a different number of messages. This was done to put them in direct comparison. No quality of standard policies were used, for MQTT this means that level 0 was used.
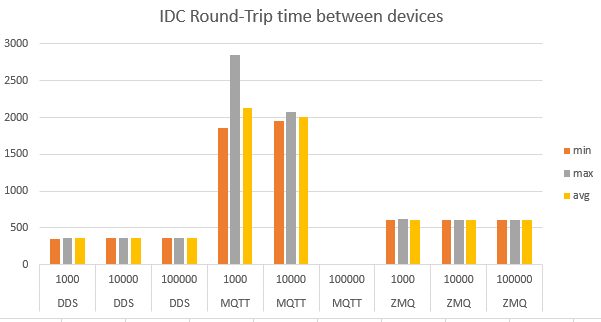
The value on the X-axis is time in microseconds. The values on the Y-axis is the protocol and the number of messages. The graph shows that the amount of messages has a minimal amount of influence on performance for each protocol. Meaning each protocol is stable in the speed of sending and receiving messages. However, MQTT is the least stable of the protocols when looking at the graph. Besides this, MQTT gets outperformed by the same factors as the IPC experiment. Again MQTT suffered from package loss at 100000 messages leaving the application unable to finish.
Findings Flood C++
The Flood applications write their results to a CSV file called flood.csv. This CSV file can be used to process the results of experiments done using the application. There were already two experiments done concerning inter-process communication(IPC) and inter-device communication(IDC). The results of these experiments are described below.
IPC experiment
The IPC experiment was conducted on the Lenovo Thinkpad T470 20HD000MUK. Three nodes were used to conduct the experiment. The following graph shows the results of the experiment for each protocol for a different number of messages. This was done to put them in direct comparison. No quality of standard policies were used, for MQTT this means that level 0 was used.
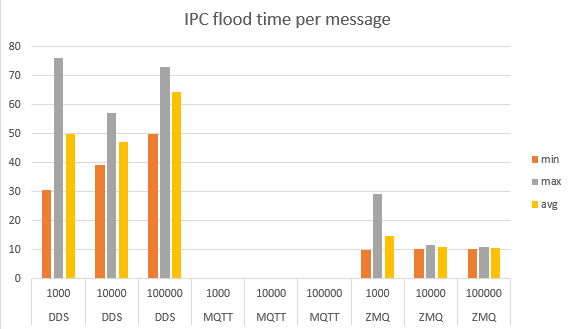
The value on the X-axis is time in microseconds. The values on the Y-axis is the protocol and the number of messages. MQTT would get a buffer overflow when sending messages in the flood experiment. Therefore no results could be extracted. The application would work to a maximum of about 150 to 200 messages. A greater number will trigger the overflow error and crash the application. For the other protocols it can be seen that ZMQ outperforms DDS. While in the round-trip it was the other way around. This probably has something to do with the fack that ZMQ uses a message queue while DDS uses a different mechanism. The message queue principle is faster for the flood case while in the round-trip it’s the other way around.
IDC experiment
The following setup was used for the IDC experiment:
Three nodes were used to conduct the experiment. The following graph shows the results of the experiment for each protocol for a different number of messages. This was done to put them in direct comparison. No quality of service policies were used, for MQTT this means that level 0 was used.
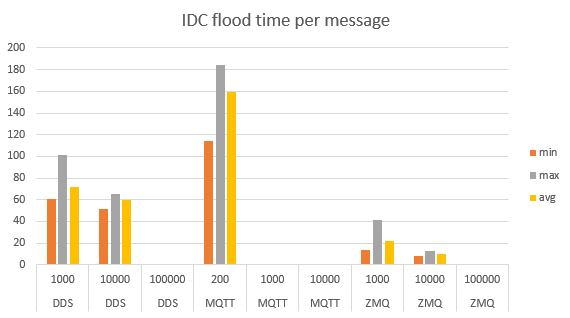
The value on the X-axis is time in microseconds. The values on the Y-axis is the protocol and the number of messages. MQTT would get a buffer overflow when sending messages in the flood experiment. Therefore no results could be extracted. The application would work to a maximum of about 150 to 200 messages. A greater number will trigger the overflow error and crash the application. The graph shows that MQTT is far slower than DDS and ZMQ. The maximum time of a message was 186 microseconds while DDS has a maximum time of 100 microseconds and ZMQ of 41. For some amount of messages no results could be gathered. This is due to package loss leaving the application unable to finish.