Quick performance tests
| authors: | Joost Baars |
|---|---|
| date: | Mar 2020 |
Description
This page shows the results of the performance tests for QoS policies within DDS. The setup of the tests is added. The tests are not 100% reliable. These tests are not performed on a real-time OS.
Most of the tests are executed on the round trip application. The most thorough test is also executed on the flood application.
Round trip
This chapter contains measurements of the QuickQoSMeasurements for different QoS configurations with the round trip application. The result of each measurement is in microseconds. This time is the time needed for one ping in the round trip. So if there are 3 devices in the round trip, and the round trip takes 600 microseconds. Then the result of the test would be 600 / 3 = 200 microseconds (per ping).
Setup 1
Setup: 2 Raspberry Pi’s communicating using DDS through a modem. The Pi’s are connected using ethernet. The modem is not connected to the internet. A laptop starts the applications using SSH.
These results are in microseconds per ping. The settings are applied on the writer and the reader.
Settings TEST 1 TEST 2 default 400 389 deadline 395 392 destination order reception 387 385 destination order source 386 387 durability persistent 389 385 durability transient 386 384 durability transient local 382 380 durability volatile 387 390 lifespan 10ms 398 399 lifespan 100ms 398 394 liveliness automatic 392 390 liveliness manual by participant 390 386 liveliness manual by topic 388 385 ownership shared 387 387 ownership exclusive 389 385 data lifecycle qos id 387 389 data lifecycle qos id 392 385 reliability best effort 358 355 reliability reliable 386 389 durability transient with durability service 1s 386 durability transient with durability service 10ms 392 history all 387 history keep last 386
Test 1: Default QoS settings with the tests Test 2: Reliability reliable default on
There is definitely a difference between the reliability configurations. There is a small overhead with the lifespan. Everything seems to have a small overhead. The durability transient does not have overhead compared to this one. The others do.
Setup 2
These next measurements are performed with a laptop containing an Intel i5 8th generation processor with a Raspberry Pi 3 model B containing a fresh Raspbian Buster Lite (13-03-2020) install. The laptop was connected to a power outlet and did not have active background processes.
Both devices were connected to the network with an ethernet cable. The laptop had an USB 2.0 to Ethernet converter in between. There is around 17 meter of ethernet cable between the devices. Additionally, a router is also in between the 2 devices. The router is connected to the internet. Additionally, the router is used by other devices for internet too. Therefore, it could cause some overhead.
The test that was executed: the “slave” of the round trip was running on the Raspberry Pi. The “master” was running on the laptop. There only were 2 devices in the round trip. Each measurement was the average of 500 round trips.
settings TEST 1 TEST 2 TEST 3 default 512 521 508 deadline 540 542 531 destination order reception 525 538 525 destination order source 521 534 533 durability persistent 514 543 537 durability transient 534 536 538 durability transient local 513 539 519 durability volatile 524 521 539 lifespan 10ms 522 540 535 lifespan 100ms 534 535 508 liveliness automatic 534 528 542 liveliness manual by participant 518 543 536 liveliness manual by topic 519 529 514 ownership shared 532 536 540 ownership exclusive 535 523 540 data lifecycle qos id 535 540 540 data lifecycle qos id 499 533 540 reliability best effort 521 540 529 reliability reliable 535 534 537 durability transient with durability service 1s 523 530 519 durability transient with durability service 10ms 535 533 536 history all 535 536 536 history keep last 531 534 509
The data from the table is visualized in a graph. The graph below shows the three test columns from the table.
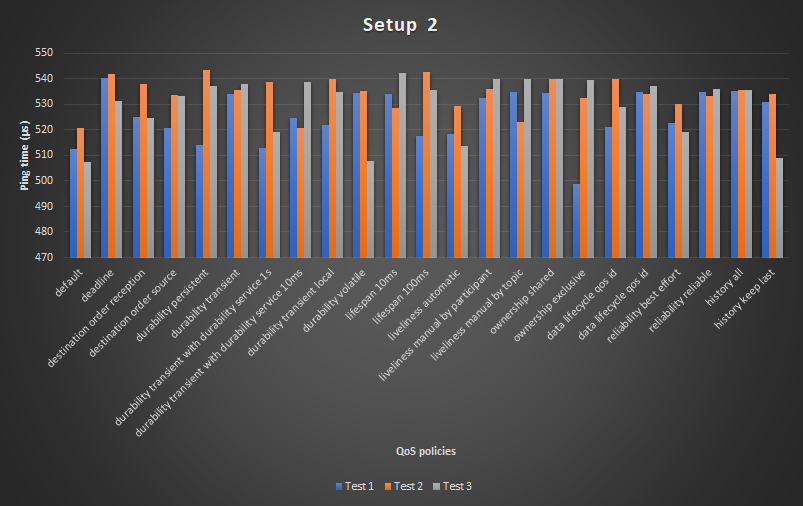
Interesting results: Between test 2 and 3, the differences are not noticable. Some tests even went noticably faster on test 3. Although, I would expect that test 3 would be noticably slower compared to test 2. Because reliability reliable should be slower and is mostly slower when directly compared. This difference could be due to background processes that interfered with the tests.
Just for reference, I compared the performance on ethernet with the performance on WiFi. Time with both devices on ethernet: ~1200 (lot of deviation, measurement of ~1700 and ~1000) microseconds. Time with the RPi on ethernet and the laptop on WiFi: ~525 microseconds (measurement of ~500 and ~540, much less deviation)
Setup 3
This setup is the same as setup 2. But this setup contains (much) more measurements.
settings TEST 1 TEST 2 TEST 3 TEST 4 TEST 5 TEST 6 TEST 7 AVERAGE AVERAGE 2 default 539 534 508 528 526 525 515 525 518 deadline 537 540 508 532 502 530 535 526 527 destination order reception 538 518 525 521 500 500 525 518 518 destination order source 531 534 508 519 526 518 503 520 524 durability persistent 533 529 525 527 491 533 509 521 517 durability transient 535 514 531 528 520 533 479 520 521 durability transient with durability service 1s 535 508 523 531 529 531 510 524 517 durability transient with durability service 10ms 524 532 525 527 530 502 506 521 527 durability transient local 531 502 519 520 520 533 528 522 521 durability volatile 537 530 498 522 524 529 501 520 524 lifespan 10ms 520 536 506 522 529 538 528 525 528 lifespan 100ms 538 519 522 511 532 517 545 526 532 liveliness automatic 529 518 506 506 507 512 513 513 512 liveliness manual by participant 538 534 527 524 522 531 530 529 526 liveliness manual by topic 539 534 521 504 528 528 527 526 521 ownership shared 563 531 523 524 528 529 503 529 518 ownership exclusive 537 537 527 523 528 532 519 529 523 data lifecycle qos id 533 508 500 524 528 523 533 521 513 data lifecycle qos id 512 467 502 520 526 529 531 512 516 reliability best effort 508 498 506 518 528 518 524 514 512 reliability reliable 533 532 506 506 533 526 500 519 524 history all 532 505 517 506 493 510 516 511 520 history keep last 536 522 525 505 526 526 507 521 521 latency budget 1000ms 539 524 525 524 500 534 527 525 514 latency budget 10ms 534 508 527 520 500 524 526 520 519 latency budget 10ms 535 534 504 502 494 524 528 517 515 presentation topic 525 534 526 512 507 499 529 519 518 presentation group 535 535 500 517 509 525 520 520 509 presentation instance 537 505 530 514 500 505 526 516 519 resource limits 528 532 525 488 522 516 531 520 519 time based filter 1s 538 534 499 525 528 525 533 526 524 time based filter 10ms 531 526 515 524 495 528 528 521 521 transport priority of 1 536 498 521 524 529 518 531 522 522 transport priority of 100 517 511 524 525 511 526 528 520 520 writer data lifecycle true 506 535 529 509 529 526 530 523 519 writer data lifecycle false 537 529 525 522 520 525 519 525 523 partition 537 511 521 521 527 537 534 527 515 AVERAGE 532 522 517 518 517 523 521 AVERAGE AVERAGE 2 AVERAGE 2 523 527 520 510 517 522 520
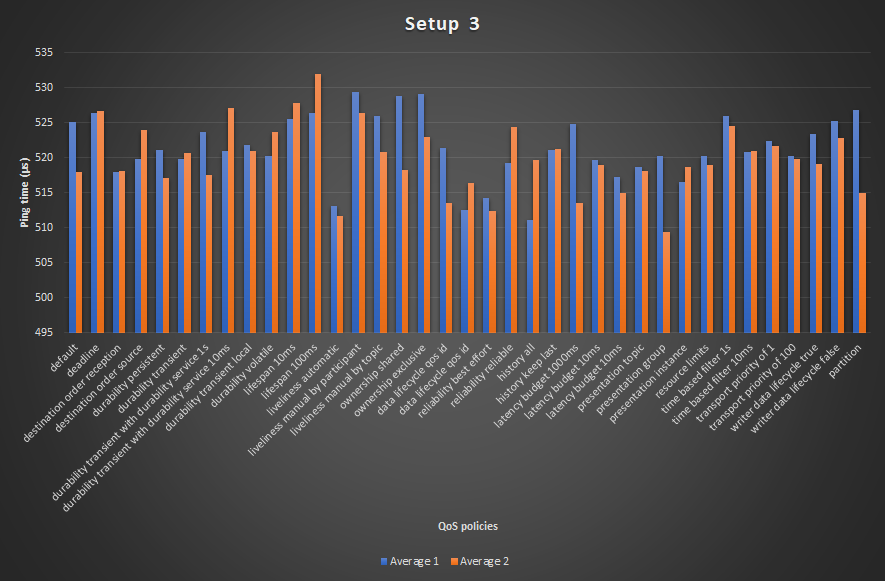
The data from the table is visualized in graphs. The graph below shows the two average columns from the table.
The graph below shows the two average rows from the table.
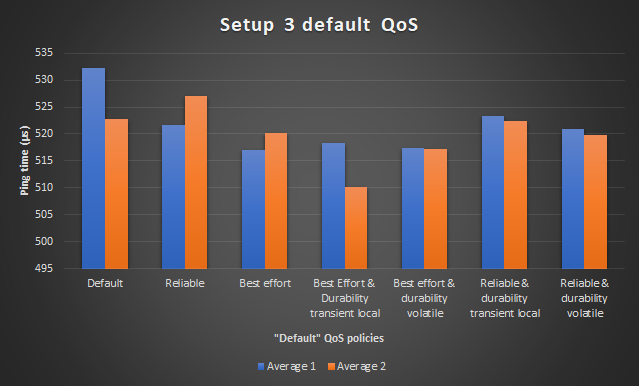
The AVERAGE 2 are the average measurements of a second execution of the
same measurements. These are included for comparing accuracy.
The graphs clearly show a lot of deviation between the average measurements. The average of the first test should be about the same as the average of the second test. The biggest deviation is about 2.3% or 12 microseconds.
Conclusions between the tests:
The reliability reliable is clearly a bit slower compared to the reliability
best effort. The durability kinds do not seem to differ a lot. It seems that
durability transient local is a bit slower. This can also be because the tests
are not accurate enough (if you compare the results with AVERAGE 2).
Conclusion between different QoS policies:
- Lifespan causes some noticable overhead.
- Liveliness automatic seems to be faster compared to manual liveliness.
- Ownership also seems to give some overhead.
- History keep all/keep last, keep last seems to be slower.
For the rest, I don’t see really interesting data.
Setup 4
This setup focusses on a reliable test without much deviation. This is not 100% possible because the OS used is not a real-time OS.
This setup uses 2 Raspberry Pi’s with each a clean install of Raspbian Buster 13-03-2020. The Raspberry Pi’s used are a Raspberry Pi 2 model B and a Raspberry Pi 3 model B.
These Raspberry Pi’s only have the necessary dependencies installed.
The setup can be found in the image below. All devices are connected using ethernet cables.
![Internet .. [Router] : Disconnected during tests
[Router] <-left-> [Raspberry Pi 2 model B] : 2m ethernet
[Router] <-right-> [Raspberry Pi 3 model B] : 2m ethernet
[Router] <--> [Laptop] : SSH, 2m ethernet](../../../_images/plantuml-ee991fa53641270f7c7e6702149e0ef5bdd3e79a.png)
This setup contains a controlled network with no influence of other devices. The laptop is connected to both devices using SSH. This laptop also executed the application on the Raspberry Pi’s (by SSH).
The Raspberry Pi 3 model B plus was the master with ID = 1.
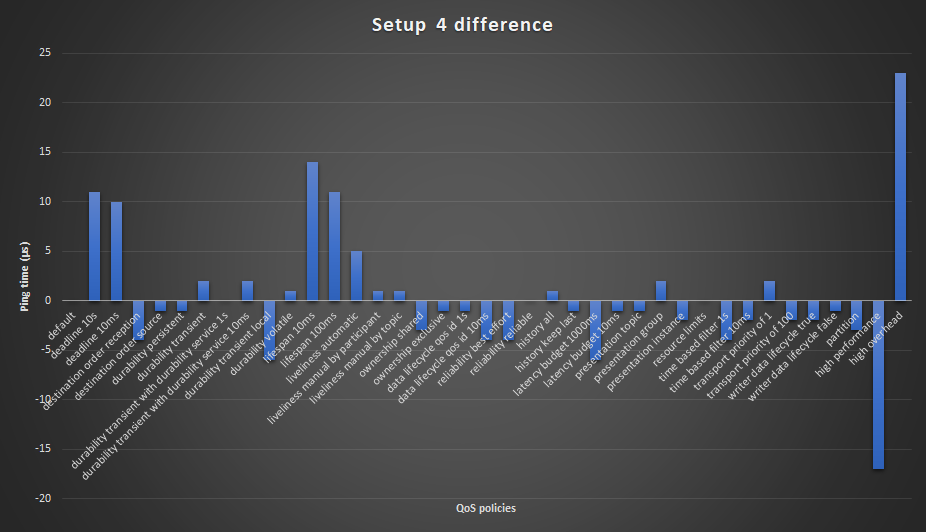
settings 1 2 3 4 5 6 7 8 9 10 11 default 355 324 327 310 332 347 328 340 333 334 0 deadline 10s 346 346 338 334 337 345 364 346 344 341 11 deadline 10ms 344 348 340 329 343 346 346 346 343 343 10 destination order reception 338 328 327 312 328 325 324 349 329 330 -4 destination order source 339 334 334 318 329 325 334 342 332 332 -1 durability persistent 337 329 333 332 329 324 329 347 332 333 -1 durability transient 344 329 336 329 334 329 336 344 335 334 2 durability transient with durability service 1s 343 328 330 332 327 327 327 348 333 331 0 durability transient with durability service 10ms 343 335 333 335 323 333 333 342 335 334 2 durability transient local 334 329 323 323 317 327 330 333 327 323 -6 durability volatile 344 334 336 331 337 323 328 337 334 331 1 lifespan 10ms 357 349 346 329 343 349 347 354 347 346 14 lifespan 100ms 347 345 339 331 346 345 351 352 344 349 11 liveliness automatic 10ms 352 334 339 328 341 333 331 345 338 335 5 liveliness manual by participant 10ms 343 333 335 320 339 333 327 343 334 333 1 liveliness manual by topic 10ms 339 326 338 316 337 331 338 346 334 334 1 ownership shared 345 328 328 312 333 323 326 343 330 333 -3 ownership exclusive 342 334 337 311 331 323 330 347 332 331 -1 data lifecycle qos id 1s 341 324 333 315 334 327 329 349 332 331 -1 data lifecycle qos id 10ms 334 328 327 317 330 327 328 341 329 331 -4 reliability best effort 335 330 329 322 332 323 333 333 329 330 -4 reliability reliable 334 334 333 333 327 329 335 338 333 328 0 history all 346 326 325 319 335 350 329 340 334 331 1 history keep last 343 331 332 316 329 328 333 343 332 333 -1 latency budget 1000ms 336 326 324 311 329 327 323 340 327 331 -6 latency budget 10ms 342 326 330 316 336 326 334 347 332 331 -1 presentation topic 336 329 337 323 329 328 331 340 332 335 -1 presentation group 346 334 331 315 333 335 345 340 335 331 2 presentation instance 344 324 333 316 331 327 332 339 331 329 -2 resource limits 347 332 334 319 334 324 333 339 333 334 0 time based filter 1s 336 324 324 316 326 327 329 348 329 332 -4 time based filter 10ms 346 335 329 319 330 328 326 340 331 331 -2 transport priority of 1 345 335 334 317 328 334 350 338 335 333 2 transport priority of 100 343 334 323 320 324 322 336 344 331 331 -2 writer data lifecycle true 343 328 326 312 329 326 335 347 331 331 -2 writer data lifecycle false 342 327 337 312 327 328 338 348 332 333 -1 partition 345 327 328 311 333 324 328 340 330 332 -3 high performance combination 318 311 323 317 316 316 316 315 316 317 -17 high overhead combination 354 357 358 355 354 353 357 358 356 352 23 AVERAGE 342 332 332 321 332 331 334 343 AVERAGE 2 343 331 332 321 332 333 332 342
The data from the table is visualized in graphs. The graph below shows the two average
columns from the table. The accuracy of the measurements is the difference between
Average 1 and Average 2.
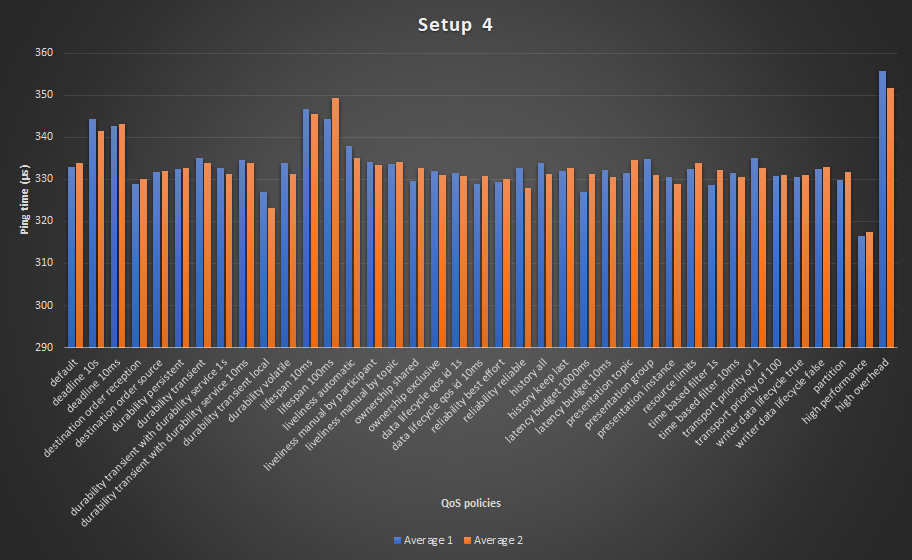
The difference row can be seen in the graph below. This graph clearly shows what QoS policies are faster / slower compared to the default QoS.
The graph below shows the two average rows from the table. The accuracy of the measurements is
the difference between Average 1 and Average 2.
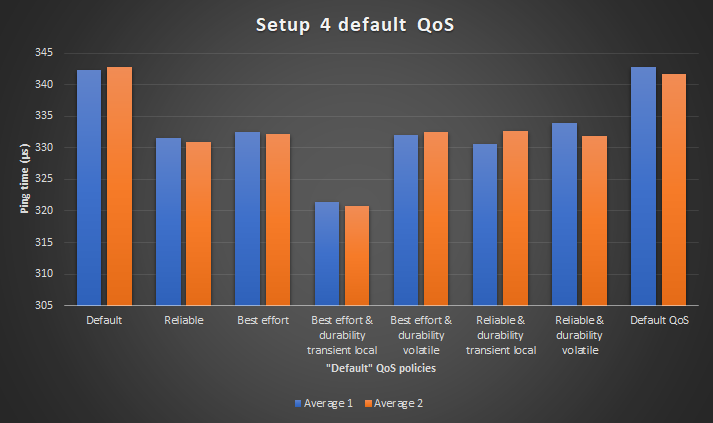
The AVERAGE 2 are the average measurements of a second execution of the
same measurements. These are included for comparing accuracy.
- The high performance combination from the tests:
- History keep last
- Reliability best effort
- Ownership shared
- Durability transient local
- Presentation instance
- The high overhead combination from the tests:
- History keep all
- Reliability reliable
- Ownership exclusive
- Lifespan 10ms
- Deadline 10ms
- Liveliness automatic 10ms
- Latency budget 1s
The graphs clearly show that there is not a lot of deviation between the average measurements. This is definitely the case if you compare it with Setup 3. The worst deviation is 5 microseconds or 1.4%. Which is around 40% accuracy gain compared to Setup 3.
Most of the measurements don’t have interesting results. There are a few measurements with noticable overhead.
- Interesting results from column 9 and 10:
- deadline 10s (noticable overhead)
- lifespan (10 and 100ms) (noticable overhead)
- durability transient local (better performance)
- Liveliness automatic (small overhead)
- Interesting results from the AVERAGE rows:
- Test 1 and 8: Much overhead for the default QoS policies
- Test 4: Performance gain
It would be interesting to see why the default QoS policies cause more overhead compared to other configurations.
The liveliness has a minor overhead compared to the other measurements. I would expect more overhead because DDS intances must ping every 10ms that they are alive.
The lifespan is the lifespan of a message. Therefore, messages that exceed the lifespan are removed from the DDS network. These checks cause noticable overhead. 10 or 100ms lifespan does not seem to matter a lot. RTI documentation says that this QoS policy should not significantly impact the use of resources.
The deadline is the maximum time between writing a new value for the writer and between reading new messages for the reader. These checks seem to cause rather much overhead.
For the durability, according to RTI’s documentation, the durability volatile should cause the least overhead. That is because this one does not save / deliver old samples. Transient local saves and delivers messages as long as the writer exists. This means that the implementation of saving probably causes less overhead compared to not saving (or removing?).
I would expect that the reliability QoS would be noticable. But during these tests, there is no noticable difference. The reliability QoS policy configures if messages should be reliably received. If so, it checks if the message is correctly received by the reader. If the message is not correctly received, then it is resend. Therefore, I would expect that this would cause noticable overhead like Setup 1. Setup 1 is less reliable though because of less measurements. Additionally, it could differ because of the set-up (different routers, different OS).
I think the other QoS policies don’t have to cause overhead. So those results are all as expected.
Flood
The same test is performed with flood instead of round trip. This test was a bit harder to execute because some QoS configurations could not reliably be executed.
The numbers that are given are in microseconds per message for the flood. This test was executed with 2 different devices in the flood loop.
- The following tests were removed compared to the round trip:
- Reliability best effort (unreliable communication what resulted in lost messages)
- Lifespan 10ms (Some messages took longer to be received and therefore were removed, what resulted in lost messages)
- History keep last (This one would probably still work, but was removed because messages may not be lost) (this one was still active in the high performance test)
- Resource limits (the resource limits was set-up so only the last 5 messages in the buffer exist. The rest was removed. This resulted in lost messages)
The test setup was the same as Setup 4. The only difference was that the Raspberry Pi 2 model B was the master instead of the Raspberry Pi 3 model B.
| settings | TEST 1 | TEST 2 | TEST 3 | AVERAGE 1 | AVERAGE 2 | AVERAGE 3 |
| default | 154.3 | 104.3 | 154.8 | 137.8 | 166.4 | 134.2 |
| deadline 10s | 105 | 107.3 | 107.9 | 106.8 | 120.9 | 104 |
| deadline 10ms | 124.1 | 127.8 | 126 | 126 | 148.9 | 145.5 |
| destination order reception | 103.7 | 177.4 | 116.6 | 132.6 | 101 | 105.1 |
| destination order source | 106.4 | 105.4 | 106.8 | 106.2 | 109.8 | 105.5 |
| durability persistent | 168.5 | 103.8 | 152.3 | 141.6 | 117.9 | 133.3 |
| durability transient | 106 | 106.4 | 104 | 105.5 | 116.5 | 106.3 |
| durability transient with durability service 1s | 105.6 | 105.7 | 106.3 | 105.9 | 121 | 104.6 |
| durability transient with durability service 10ms | 105.8 | 104.3 | 102.9 | 104.3 | 118.7 | 120.5 |
| durability transient local | 105.1 | 175.7 | 105.5 | 128.8 | 101.5 | 101.6 |
| durability volatile | 105.7 | 106.1 | 105.5 | 105.8 | 140 | 133 |
| lifespan 100ms | 162.9 | 107.7 | 178.5 | 149.7 | 103.6 | 122.8 |
| liveliness automatic 10ms | 105.2 | 178.5 | 103.4 | 129.1 | 118.4 | 108.4 |
| liveliness manual by participant 10ms | 107.3 | 109.2 | 107.5 | 108 | 121.8 | 119.2 |
| liveliness manual by topic 10ms | 107.8 | 108.4 | 107.1 | 107.7 | 103.6 | 102.8 |
| ownership shared | 105.5 | 114.8 | 104.8 | 108.4 | 116.6 | 117.2 |
| ownership exclusive | 105.2 | 110.8 | 105.8 | 107.3 | 129.4 | 102.1 |
| data lifecycle qos id 1s | 154.2 | 155.4 | 154.3 | 154.6 | 108.1 | 122.7 |
| data lifecycle qos id 10ms | 177.8 | 106.6 | 151.8 | 145.4 | 125.4 | 114.5 |
| reliability reliable | 114.7 | 106.5 | 111.8 | 111 | 101 | 104.1 |
| history all | 104.4 | 114.3 | 108.2 | 109 | 116.5 | 113.1 |
| latency budget 1000ms | 112.7 | 115.9 | 106.7 | 111.8 | 116 | 101.3 |
| latency budget 10ms | 225.3 | 157 | 120.1 | 167.5 | 100.3 | 128.6 |
| presentation topic | 105.5 | 117.1 | 154.4 | 125.7 | 104.1 | 132.4 |
| presentation group | 112.9 | 105.8 | 103.3 | 107.3 | 125.1 | 100.3 |
| presentation instance | 105.7 | 105.7 | 105.6 | 105.7 | 121.8 | 124.3 |
| time based filter 1s | 105.5 | 146.4 | 105.5 | 119.1 | 119.3 | 101.7 |
| time based filter 10ms | 114.9 | 104.4 | 104.2 | 107.8 | 103.8 | 129.9 |
| transport priority of 1 | 153.2 | 105.3 | 149.7 | 136.1 | 100.4 | 122.5 |
| transport priority of 100 | 105.9 | 106.5 | 113.5 | 108.6 | 104.4 | 104.3 |
| writer data lifecycle true | 104.7 | 112.4 | 104.8 | 107.3 | 143.4 | 117.4 |
| writer data lifecycle false | 105.3 | 145.7 | 105.7 | 118.9 | 125.8 | 116.6 |
| partition | 112.7 | 107.8 | 106.7 | 109.1 | 106.5 | 116.4 |
| high performance combination | 112.4 | 112.5 | 145.5 | 123.4 | 100.4 | 139.5 |
| high overhead combination | 255.3 | 146 | 139.5 | 180.3 | 152.6 | 124.6 |
| AVERAGE 1 | 124.8 | 120.7 | 119.6 | |||
| AVERAGE 2 | 120.6 | 116.5 | 117 | |||
| AVERAGE 3 | 116.2 | 116.6 | 117 |
The average columns are visualized in the graph below.
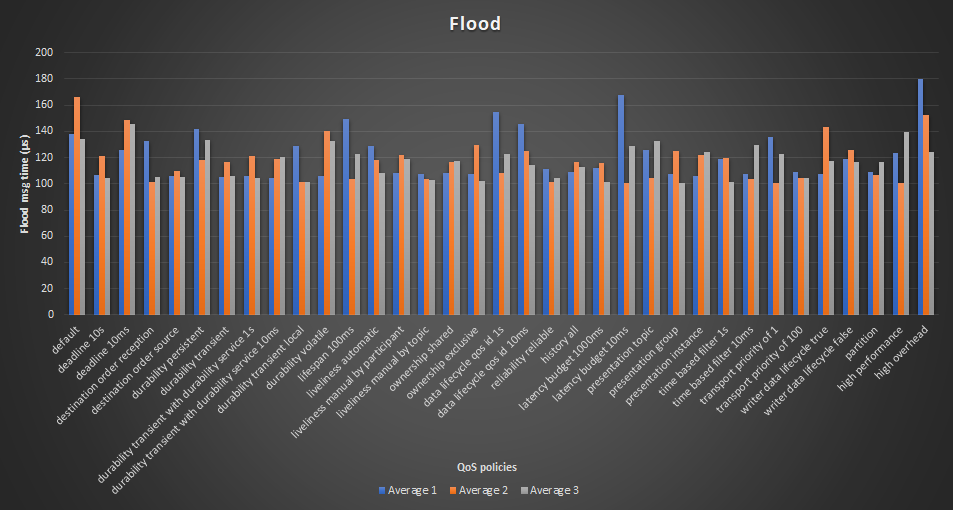
There is a lot of deviation between the average results. Mainly for the accuracy
of the rows. This can easily be seen in the graph (the Average 1,
Average 2 and Average 3 should be around the same height).
The biggest deviation is about 67 microseconds or about 60%!
For that reason, these measurements are difficult to reliably analyze.